 INGInious
This final (and longer) project will give you the opportunity to have some fun while competing with other students to solve a real and difficult prediction task inspired by a biomedical research topic. Your job will be twofold:
- build the best possible classification model on a training set to predict the (undisclosed) class labels on a given test set,
- predict the actual classification performance your model will have on the test set.
Design choices
The "training" set is referred here in a broad sense, that is the fraction of the dataset on which the class labels are disclosed. It is up to you to decide what to do with this labeled set and, for instance, whether you split it (once or several times, possibly recursively) into actual training versus some validation fraction. More generally, this project is intended to be open as it is the case for a real task. Only the outcome matters! Many design choices are left open and you must specify them. Here is a non-exhaustive list of things you might have to consider.
- Do you need to pre-process, to filter out, to normalize, etc., the available data? (look at the data,... LOOK AT THE DATA!)
- How are you going to address the fact that some feature values could be numerical (either
intorfloat) while others could be categorical or possibly boolean? Are there specific feature values only observed in the test but not in the training? - Should you consider all the available features? Should you define new or additional features from the existing ones? Should the newly defined features be crafted by hand, or generated automatically by other methods?
- Which methodology are you going to use to learn a model, to fix its possible hyper-parameters and to predict its classification performance on the test set?
- Which learning algorithm do you consider? You are free to choose the one you estimate more appropriate to the task. It needs not be (but it might be, of course) a learning algorithm that has been presented in the course. You can even consider several learning algorithms and/or produce and combine several models as long as your final prediction defines a unique label for each test example (ensemble methods? bagging?...).
- What else?... The sky (and computing power) is the limit!
Competition performance metric
Since the dataset needs not be perfectly balanced in terms of class priors, the chosen test performance metric of a classifier is defined as the balanced classification rate (BCR). The BCR computes the classification rate for each class and reports the arithmetic average of those rates over all classes. In a binary classification context, BCR is simply the average between specificity and sensitivity. More generally, with \(C\) classes:
where:
- \(n_i\) denotes the number of examples from class \(i\) included in the test set,
- \(TP_i\) denotes the number of correctly classified examples from class \(i\) in the test set,
- \(C\) denotes the number of classes.
Note that \(\frac{TP_i}{n_i}\) is also denoted below as \(p_i\) and simply refers to the proportion of correctly classified test examples from class \(i\).
Note also that a trivial classifier predicting all examples as belonging to the same class has a test \(BCR = \frac{1}{C}\), no matter how the class priors are distributed (whenever the single predicted class is never actually observed in the test set, BCR = 0 assuming \(\frac{0}{0}\) = 0.), while a perfect classifier has \(BCR=1\) (what is the expected BCR of a classifier predicting uniformly at random among the classes? Does it depend on the class priors?).
Since your task is not only to produce a model with the best possible BCR on the test set but also to predict how well your model is going to perform on this test set, we distinguish between the true test \(BCR\) of your model and your predicted test \(\widehat{BCR}\) on this test set. The actual competition performance metric \(P\) (according to which you will be ranked and graded) is as follows:
where:
- \(\Delta(BCR) = | BCR - \widehat{BCR} |\)
- \(\sigma = \frac {1} {C} \sqrt{\sum_{i=1}^C \frac{p_i(1-p_i)}{n_i}}\), where \(p_i\) is the proportion of correctly classified test examples from class \(i\) and \(n_i\) is the number of test examples from class \(i\).
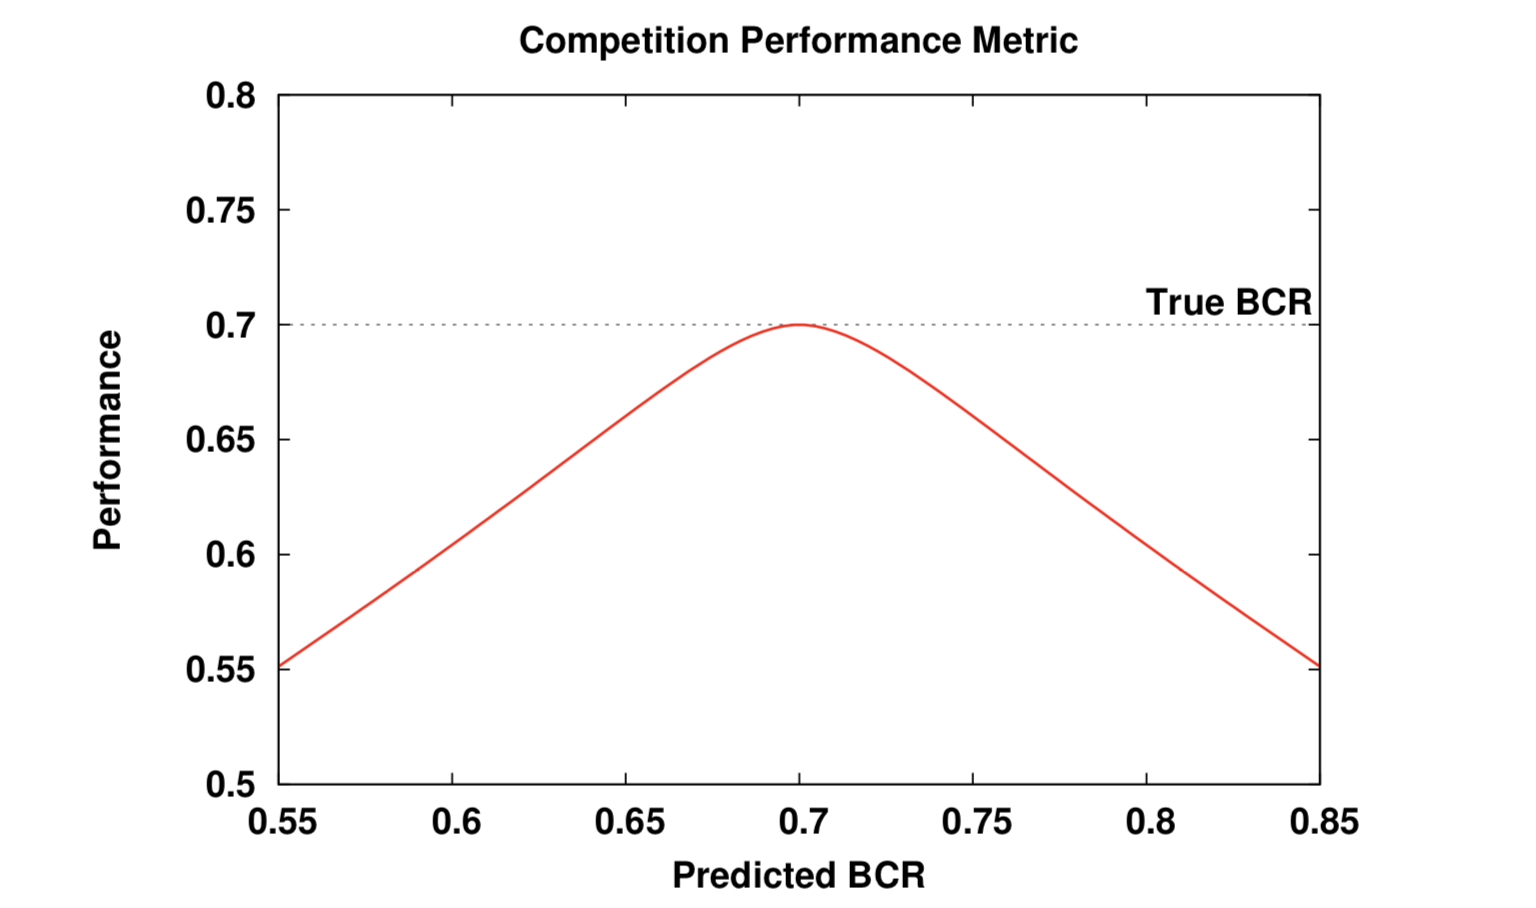
This competition performance metric is directly inspired from the International Performance Prediction Challenge WCCI 2006. The larger \(P\) the better. To maximize \(P\) you need to get the best possible test \(BCR\) and to make sure that your predicted \(\widehat{BCR}\) is as close as possible to the actual test \(BCR\) of your model. Any deviation between both is penalized (by \(- \Delta(BCR)\)) while the influence of such penalty is limited in the region of uncertainty where \(\Delta(BCR)\) is commensurate with \(\sigma\), the error bar on your true test BCR.
Here is a typical plot of the performance metric \(P\) as a function of the predicted \(\widehat{BCR}\) for a true test \(BCR\) being equal to 70 %.
The only thing you will need to provide for us to compute \(P\) is your predicted \(\widehat{BCR}\) and the predicted class labels of the test examples. From this and knowing the undisclosed true class labels, we will compute the actual \(BCR\) of your model, its estimated error bar \(\sigma\) and the resulting \(P\). The highest \(P\) among all submissions will define the winner of the competition (and earn our congratulations!).
Note that you will not know your \(P\) score before the closing of the competition, not even your rank among the other competitors. This is the game!
The prediction task
You are a data analyst and machine learning expert in a chemical lab and you have been tasked to study the toxicity of different chemical products based on the molecules that compose them and how present they are.
More precisely, your task is to decide if a given product is toxic (positive) or not toxic (negative).

Generated with ChatGPT on 11th February 2026.
You are provided with a partially annotated dataset. The train split contains 3,000 examples and the test split contains 1,000 examples. Each feature corresponds to the quantity of the corresponding molecule in the product. They are obtained through a long, tidious, noisy, and difficult process (that is not relevant for this project).
Each data split includes 1,024 input float features.
The output class to be predicted:
- The
labelvariable (categorical) indicates the toxicity of the product:positive, negative.
The data, available on Moodle, is split into 3 files:
A5_2026_train.csvwhich contains the 1,024 input features of 3,000 examples to train and validate your models.A5_2026_train_labels.csvwhich contains the corresponding classes of the 3,000 training (and validation) examples and their index.A5_2026_test.csvwhich contains the 1,024 input features of 1000 test examples. It is your task to predict one class for each test example.
Once these files are stored on your local disk in the current working directory of a python session, the data can easily be loaded in pandas dataframes as follows.
import pandas as pd

x_train = pd.read_csv("A5_2026_train.csv")
y_train = pd.read_csv("A5_2026_train_labels.csv", index_col=0)
x_test = pd.read_csv("A5_2026_test.csv")