 INGInious
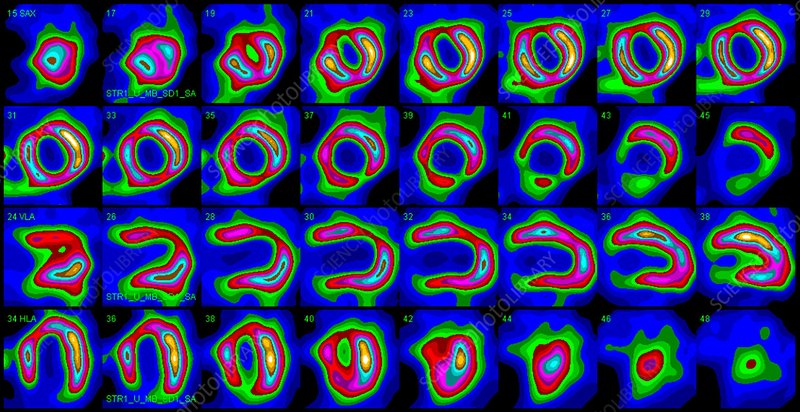
Single-photon emission computed tomography (SPECT) is an nuclear medicine imaging technique. It builds 3-D images of targeted organs using a radioactive substance and a special gamma camera. This allows to assess if the imaged organs are functionning properly. These 3-D pictures are often represented as a set of 2-D slices:
You are in charge of implementing machine learning models that analyzes SPECT images of the heart and predicts whether or not the heart is in correct condition. Each of the patients is classified into two categories: normal and abnormal. The dataset consists of 417 SPECT image sets and was processed to extract 44 continous features that summarize the original images. The dataset has been partitioned for you in two files, used respectively for training and testing your models:
- A training set with 220 samples, available here: HeartTrain.csv
- A test set with 197 samples, available here: HeartTest.csv
Those .csv files should be read and loaded in data frames. The
columns, named F_1 to F_44, correspond to the numerical input features. The last column, named labels, represents the class label, in binary encoding (0:abnormal, 1:normal).
This data can be loaded into DataFrame's using python's pandas library:
import pandas as pd

train_df = pd.read_csv("HeartTrain.csv")
test_df = pd.read_csv("HeartTest.csv")
In this task, we will evaluate how support vector machines, fitted on the training data, are able to recognize abnormal from normal heart SPECT test images.
SVMs are implemented in python in sklearn.svm.SVC.